Datei:Atmospheric Transmission.svg
Originaldatei (SVG-Datei, Basisgröße: 741 × 724 Pixel, Dateigröße: 321 KB)
Diese Datei stammt aus Wikimedia Commons und kann von anderen Projekten verwendet werden. Die Beschreibung von deren Dateibeschreibungsseite wird unten angezeigt.
Inhaltsverzeichnis
Beschreibung
| BeschreibungAtmospheric Transmission.svg |
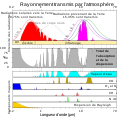
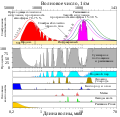
English: This figure shows the absorption bands in the Earth's atmosphere (middle panel) and the effect that this has on both solar radiation and upgoing thermal radiation (top panel). Individual absorption spectrum for major greenhouse gases plus Rayleigh scattering are shown in the lower panel. |
| Datum | |
| Quelle | This figure was prepared by Robert A. Rohde for the Global Warming Art project. |
| Urheber | Д.Ильин: vectorization (File:Atmospheric Transmission-ru.svg); Cepheiden translation back to english |
| Andere Versionen |
.png:
|
| Diese SVG-Datei enthält eingebetteten Text, der mit jedem geeigneten SVG-Editor, Texteditor oder dem SVG-Übersetzungs-Werkzeug in deine Sprache übersetzt werden kann. Für mehr Informationen siehe Über das Übersetzen von SVG-Dateien. |
This figure shows the absorption bands in the Earth's atmosphere (middle panel) and the effect that this has on both solar radiation and upgoing thermal radiation (top panel). Individual absorption spectrum for major greenhouse gases plus Rayleigh scattering are shown in the lower panel.
Both the Earth and the Sun emit electromagnetic radiation (e.g. light) that closely follows a blackbody spectrum, and which can be predicted based solely on their respective temperatures. For the Sun, these emissions peak in the visible region and correspond to a temperature of ~5500 K. Emissions from the Earth vary following variations in temperature across different locations and altitudes, but always peak in the infrared.
The position and number of absorption bands are determined by the chemical properties of the gases present. In the present atmosphere, water vapor is the most significant of these greenhouse gases, followed by carbon dioxide and various other minor greenhouse gases. In addition, Rayleigh scattering, the physical process that makes the sky blue, also disperses some incoming sunlight. Collectively these processes capture and redistribute 25-30% of the energy in direct sunlight passing through the atmosphere. By contrast, the greenhouse gases capture 70-85% of the energy in upgoing thermal radiation emitted from the Earth surface.
Data sources and notes
The data used for these figures is based primarily on Spectral Calculator of GATS, Inc. Archivkopie in der Wayback Machine which implements the LINEPAK system of calculating absorption spectra (Gordley et al. 1994) from the HITRAN2004 (Rothman et al. 2004) spectroscopic database. To aid presentation, the absorption spectra were smoothed. Features with a bandwidth narrower than 0.5% of their wavelength may be obscured.
Calculations were done on the assumption of direct vertical transmission through an atmosphere with gas concentrations representative of modern day averages. In particular, absorption would be greater for radiation traveling obliquely through the atmosphere as it would encounter more gas.
The total scattering and absorption curve includes only the components indicated in the lower panel. These represent the vast majority of absorption contributing to the greenhouse effect and follow the treatment of Peixoto and Oort (1992), but other minor species such as carbon monoxide, nitric oxide and chloroflourocarbons (CFCs) have been omitted. Also omitted was scattering due to aerosols and other sources besides Rayleigh scattering.
The peaks in the blackbody spectra were adjusted to have the same height for ease in presentation.
Lizenz
| Diese Datei wird unter der Creative-Commons-Lizenz „CC0 1.0 Verzicht auf das Copyright“ zur Verfügung gestellt. | |
| Die Person, die das Werk mit diesem Dokument verbunden hat, übergibt dieses weltweit der Gemeinfreiheit, indem sie alle Urheberrechte und damit verbundenen weiteren Rechte – im Rahmen der jeweils geltenden gesetzlichen Bestimmungen – aufgibt. Das Werk kann – selbst für kommerzielle Zwecke – kopiert, modifiziert und weiterverteilt werden, ohne hierfür um Erlaubnis bitten zu müssen.
http://creativecommons.org/publicdomain/zero/1.0/deed.enCC0Creative Commons Zero, Public Domain Dedicationfalsefalse |
References
- Gordley, Larry L., Benjamin T. Marshall, Allen D. Chu (1994). "LINEPAK: Algorithms for modeling spectral transmittance and radiance". Journal of Quantitative Spectroscopy & Radiative Transfer 52 (5): 563-580.
- L.S. Rothman, D. Jacquemart, A. Barbe, D. Chris Benner, M. Birk, L.R. Brown, M.R. Carleer, C. Chackerian Jr., K. Chance, L.H. Coudert, V. Dana, V.M. Devi, J.-M. Flaud, R.R. Gamache, A. Goldman, J.-M. Hartmann, K.W. Jucks, A.G. Maki, J.-Y. Mandin, S.T. Massie, J. Orphal, A. Perrin, C.P. Rinsland, M.A.H. Smith, J. Tennyson, R.N. Tolchenov, R.A. Toth, J. Vander Auwera, P. Varanasi, G. Wagner (2004). "The HITRAN 2004 molecular spectroscopic database". Journal of Quantitative Spectroscopy & Radiative Transfer 96: 139-204.
- Peixoto, Jose P. and Abraham H. Oort (1992) Physics of Climate, Springer ISBN: 0883187124.
Other versions
.svg:
-
Englisch .svg
-
Französisch .svg
-
Mazedonisch .svg
-
Russisch .svg
-
Koreanisch .svg
.png:
-
Englisch .png
-
Französisch .png
-
Polnisch .png
-
Japanisch .png
-
Arabisch .png
Kurzbeschreibungen
In dieser Datei abgebildete Objekte
Motiv
18. März 2021
image/svg+xml
130a81475d186ffb00ef185c7f981dd1fab93805
328.865 Byte
724 Pixel
741 Pixel
Dateiversionen
Klicke auf einen Zeitpunkt, um diese Version zu laden.
| Version vom | Vorschaubild | Maße | Benutzer | Kommentar | |
|---|---|---|---|---|---|
| aktuell | 16:19, 18. Apr. 2023 | 741 × 724 (321 KB) | wikimediacommons>Efbrazil | Adding white background color so renders correctly on smartphone |
Dateiverwendung
Die folgende Seite verwendet diese Datei:
Metadaten
Diese Datei enthält weitere Informationen, die in der Regel von der Digitalkamera oder dem verwendeten Scanner stammen. Durch nachträgliche Bearbeitung der Originaldatei können einige Details verändert worden sein.
| Breite | 209.02632mm |
|---|---|
| Höhe | 204.44635mm |


