Datei:Partial transmittance.gif
Partial_transmittance.gif (367 × 161 Pixel, Dateigröße: 67 KB, MIME-Typ: image/gif, Endlosschleife, 53 Bilder, 4,2 s)
Diese Datei stammt aus Wikimedia Commons und kann von anderen Projekten verwendet werden. Die Beschreibung von deren Dateibeschreibungsseite wird unten angezeigt.
Beschreibung
| BeschreibungPartial transmittance.gif |
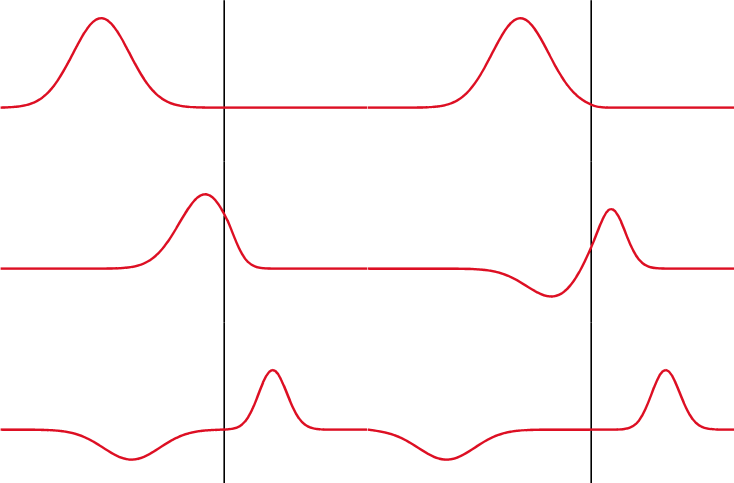
Русский: Показано классическое отражение/прохождение солитона гауссового импульса от/в более плотную среду. В реальности же, свет отражается не от поверхности, а от всех частиц тела (см. ru:КЭД). English: Illustration of partial reflection of a wave. A gaussian wave on a one-dimensional string strikes a boundary with transmission coefficient of 0.5. Half the wave is transmitted and half is reflected.
Français : Illustration de la réflection partielle d'une onde. Une onde gaussienne se déplaçant sur un ressort unidimensionnel est réfléchie/transmise au niveau d'une interface avec un coefficient de transmission de 0.5.
Español: Ilustración de una reflexión parcial de una onda. Una onda gaussiana sobre una cuerda de una dimensión choca contra un limite con un coeficiente de transmisión de 0.5. La mitad de la onda es transmitida y la otra mitad es reflejada. |
| Datum | |
| Quelle | self-made with MATLAB, source code below |
| Urheber | Oleg Alexandrov |
Lizenz
| Public domainPublic domainfalsefalse |
| Ich, der Urheberrechtsinhaber dieses Werkes, veröffentliche es als gemeinfrei. Dies gilt weltweit. In manchen Staaten könnte dies rechtlich nicht möglich sein. Sofern dies der Fall ist: Ich gewähre jedem das bedingungslose Recht, dieses Werk für jedweden Zweck zu nutzen, es sei denn, Bedingungen sind gesetzlich erforderlich. |
MATLAB source code
% Partial transmittance and reflectance of a wave
% Code is messed up, don't have time to clean it now
function main()

   % KSmrq's colors
   red    = [0.867 0.06 0.14];
   blue   = [0, 129, 205]/256;
   green  = [0, 200,  70]/256;
   yellow = [254, 194,   0]/256;
   white = 0.99*[1, 1, 1];
   black = [0, 0, 0];

   % length of the string and the grid
   L = 5;
   N = 151;
   X=linspace(0, L, N);

   h = X(2)-X(1); % space grid size
   c = 0.01; % speed of the wave
   tau = 0.25*h/c; % time grid size

   % form a medium with a discontinuous wave speed
   C = 0*X+c;

   D=L/2;
   c_right = 0.5*c; % speed to the right of the disc
   for i=1:N
      if X(i) > D
         C(i) = c_right;
      end
   end
   % Now C = c for x < D, and C=c_right for x > D

   K = 5; % steepness of the bump
   S = 0; % shift the wave
   f=inline('exp(-K*(x-S).^2)', 'x', 'S', 'K'); % a gaussian as an initial wave
   df=inline('-2*K*(x-S).*exp(-K*(x-S).^2)', 'x', 'S', 'K'); % derivative of f

   % wave at time 0 and tau
   U0 = 0*f(X, S, K);
   U1 = U0 - 2*tau*c*df(X, S, K);

   U = 0*U0; % current U

   % plot between Start and End
   Start=130; End=500;

   % hack to capture the first period of the wave
   min_k = 2*N; k_old = min_k; turn_on = 0;

   frame_no = 0;
   for j=1:End

      %  fixed end points
      U(1)=0; U(N)=0;

      % finite difference discretization in time
      for i=2:(N-1)
         U(i) = (C(i)*tau/h)^2*(U1(i+1)-2*U1(i)+U1(i-1)) + 2*U1(i) - U0(i);
      end

      % update info, for the next iteration
      U0 = U1; U1 = U;

      spacing=7;

     % plot the wave
      if rem(j, spacing) == 1 & j > Start

         figure(1); clf; hold on;
         axis equal; axis off;
         lw = 3; % linewidth

         % size of the window
         ys = 1.2;

         low = -0.5*ys;
         high = ys;
         plot([D, D], [low, high], 'color', black, 'linewidth', 0.7*lw)
%         fill([X(1), D, D, X(1)], [low, low, high, high], [0.9, 1, 1], 'edgealpha', 0);
%         fill([D X(N), X(N), D],  [low, low, high, high], [1, 1, 1], 'edgealpha', 0);

         plot(X, U, 'color', red, 'linewidth', lw);

         % plot the ends of the string
         small_rad = 0.06;

         axis([-small_rad, 0.82*L, -ys, ys]);

         % small markers to keep the bounding box fixed when saving to eps
         plot(-small_rad, ys, '*', 'color', white);
         plot(L+small_rad, -ys, '*', 'color', white);

         pause(0.1)
         frame_no = frame_no + 1;
         %frame=sprintf('Frame%d.eps', 1000+frame_no); saveas(gcf, frame, 'psc2');
         frame=sprintf('Frame%d.png', 1000+frame_no);% saveas(gcf, frame);
         disp(frame)
         print (frame, '-dpng', '-r300');

      end
   end


% The gif image was creating with the command
% convert -antialias -loop 10000  -delay 8 -compress LZW -scale 20% Frame10*png Partial_transmittance.gif
% and was later cropped in Gimp
Kurzbeschreibungen
Ergänze eine einzeilige Erklärung, was diese Datei darstellt.
In dieser Datei abgebildete Objekte
Motiv
Einige Werte ohne einen Wikidata-Eintrag
26. November 2007
Dateiversionen
Klicke auf einen Zeitpunkt, um diese Version zu laden.
| Version vom | Vorschaubild | Maße | Benutzer | Kommentar | |
|---|---|---|---|---|---|
| aktuell | 16:36, 9. Apr. 2010 |  | 367 × 161 (67 KB) | wikimediacommons>Aiyizo | optimized animation |
Dateiverwendung
Die folgenden 4 Seiten verwenden diese Datei:
